Real-time analytics for business leaders
Fortris gives you powerful, built-in dashboards to monitor activity, track performance and make better decisions - from a single business unit to the entire organization.

Organizational overview
Gain complete oversight of your digital asset operations across every business unit, region and asset type - all in one place.
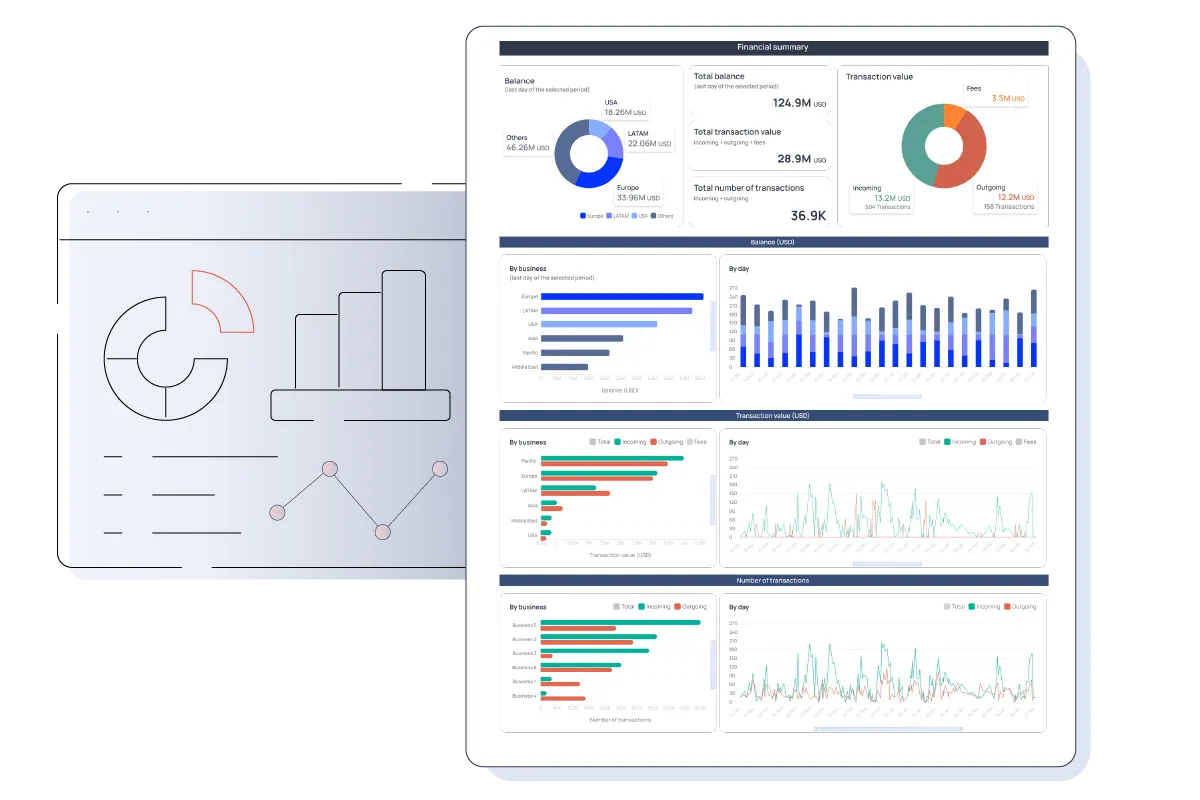
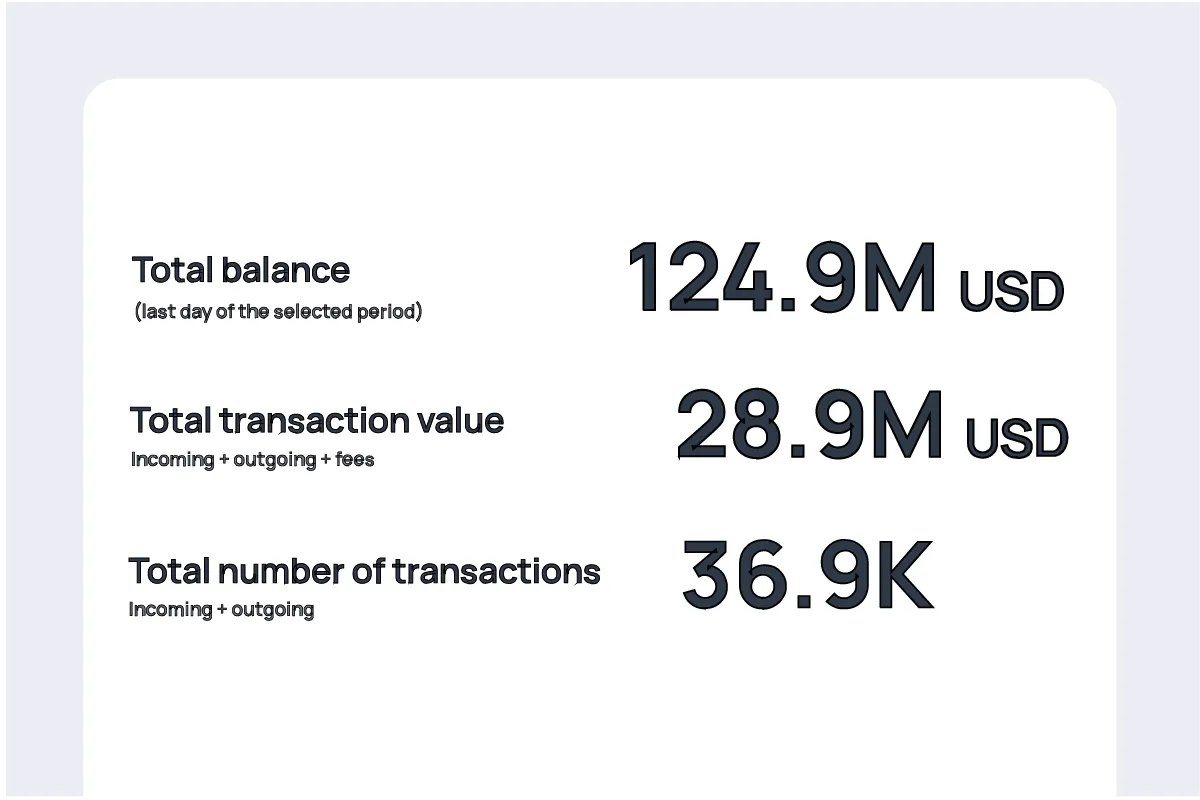
Monitor total balances, transaction volumes and fees at a glance.
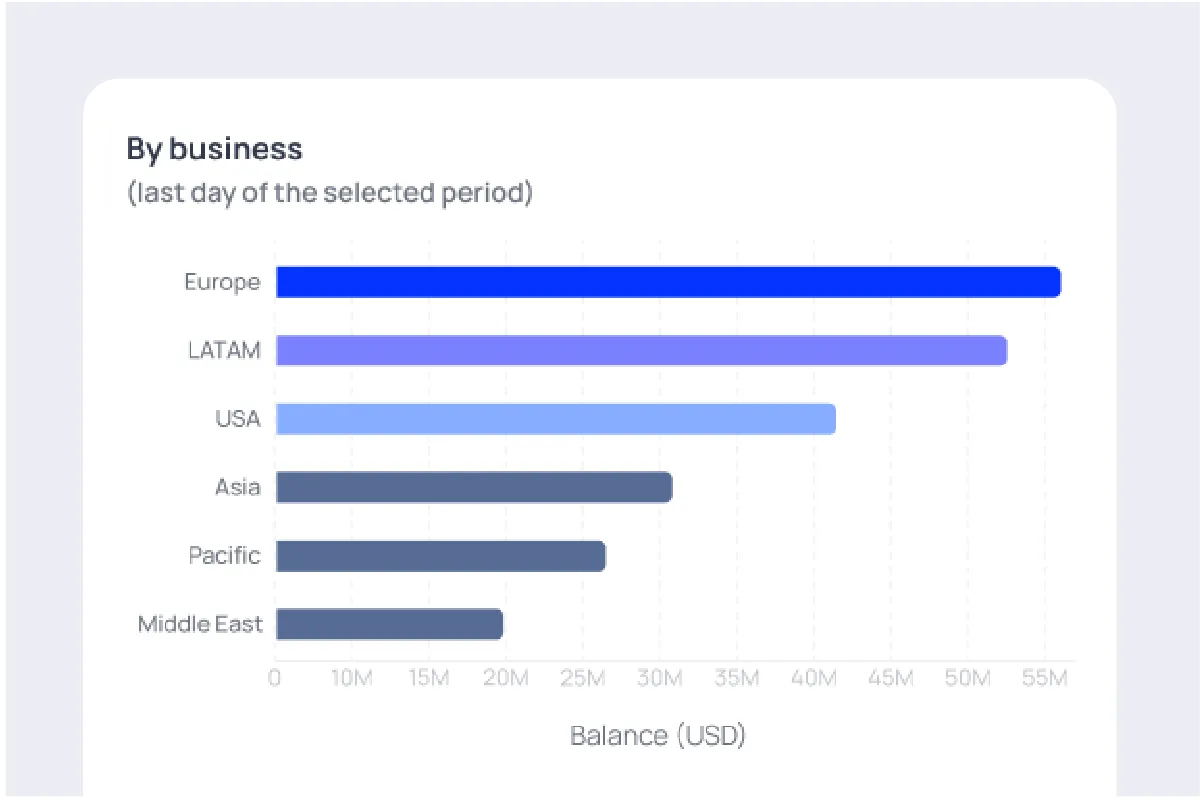
Break down data by business unit, geography or cryptocurrency.
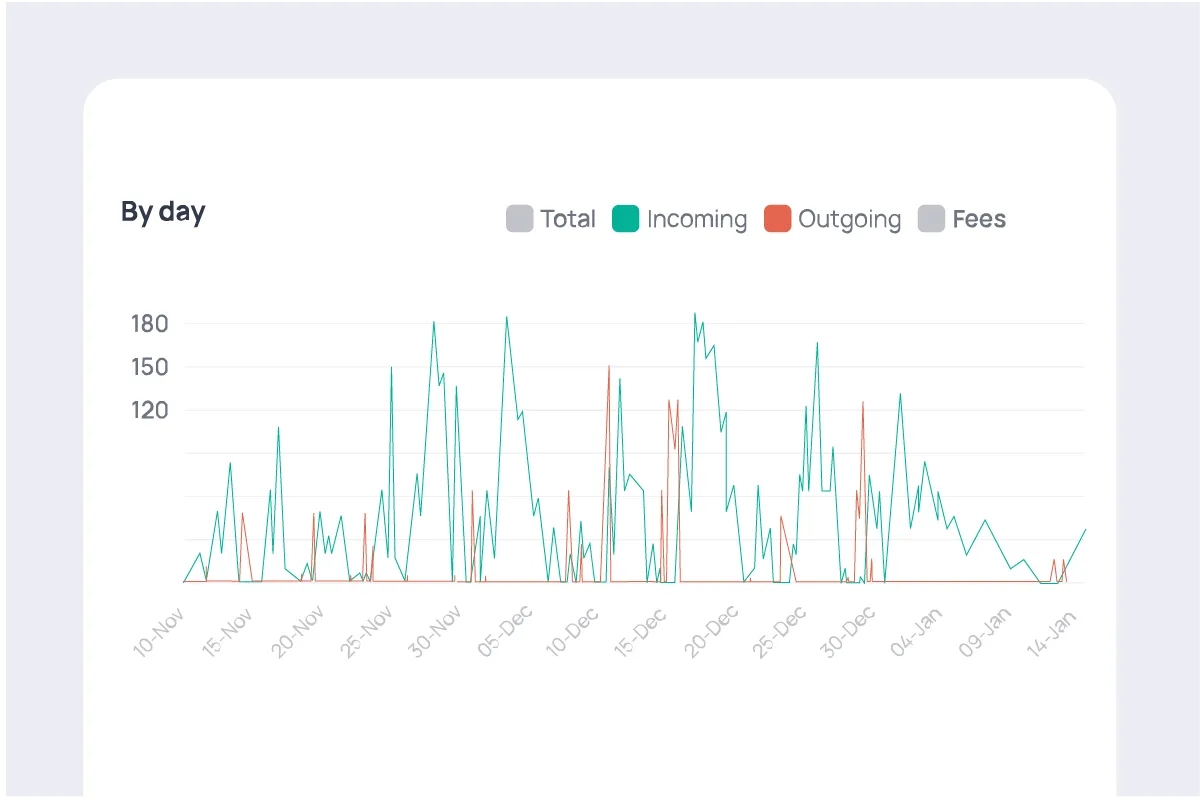
Analyze trends over time to understand flow patterns, performance and spot operational inefficiencies.
.webp)
Data is always real-time and audit-ready so you can export and report with confidence.
Business-level dashboards
Stay on top of your treasury operations with real-time visibility into balances, payments and account activity - all from a single, intuitive view.
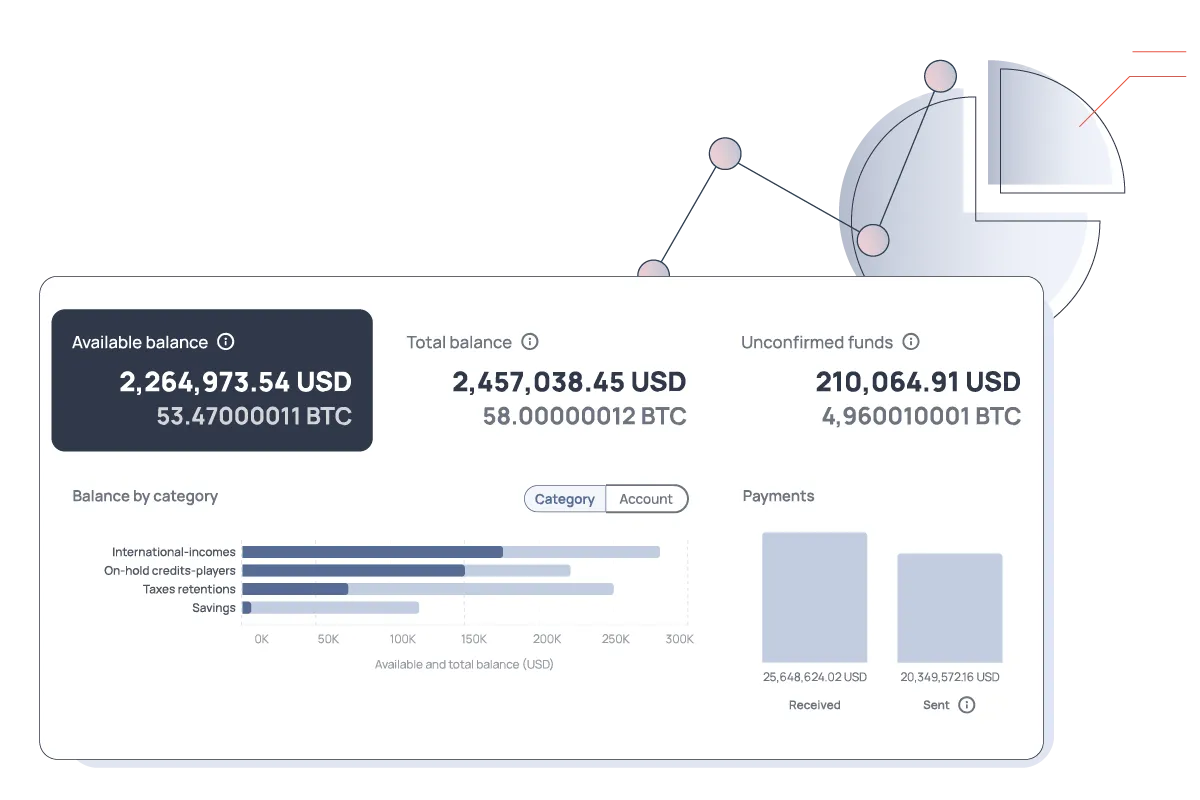
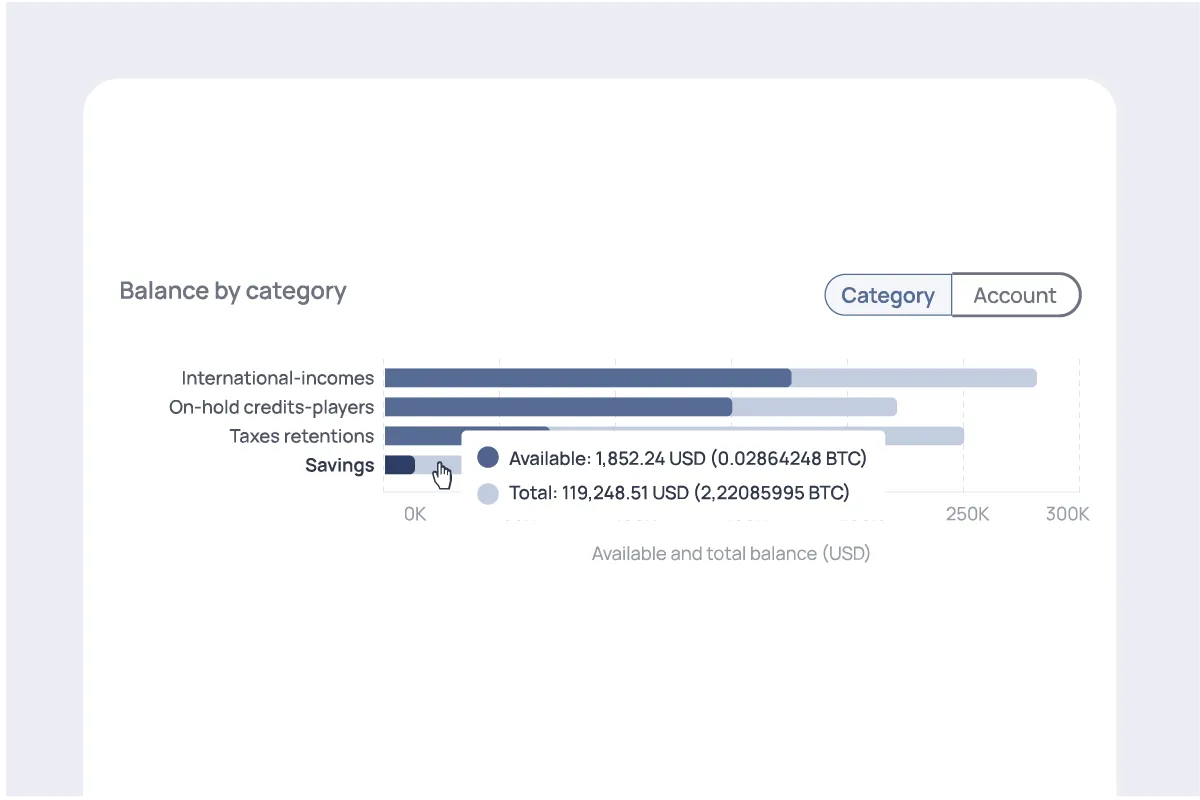
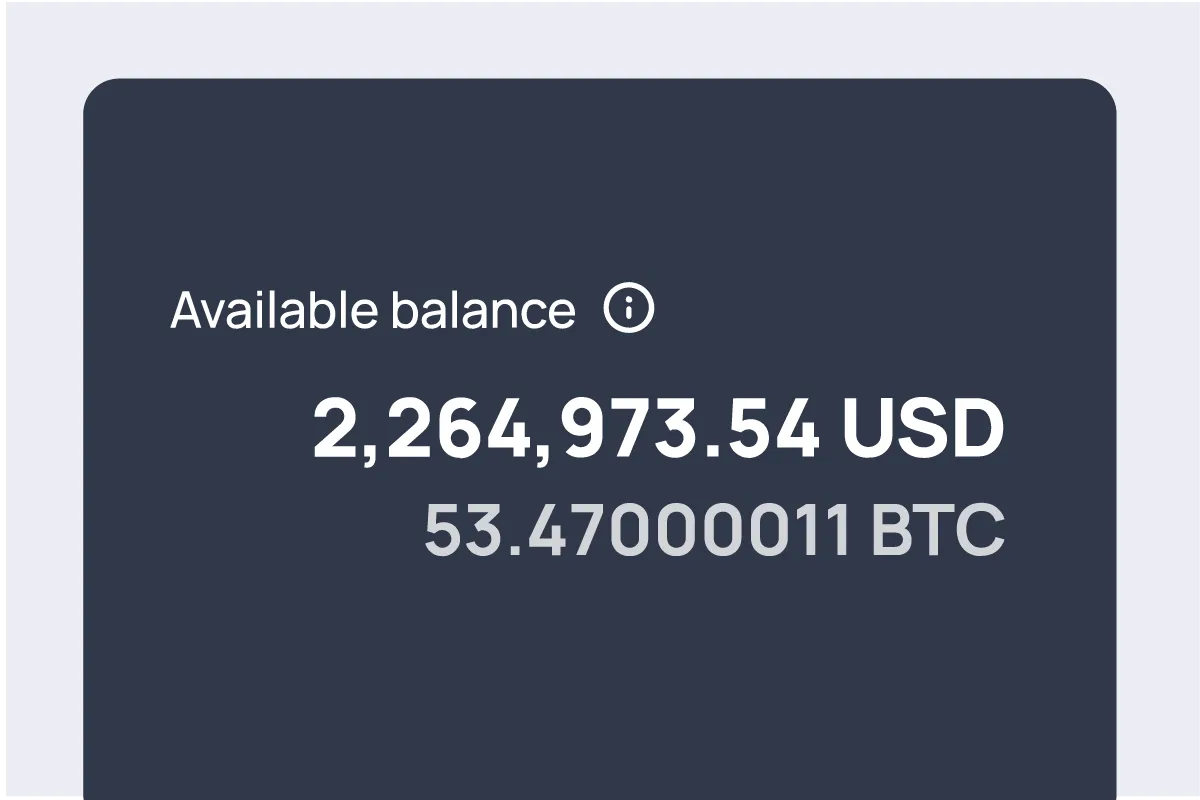
Instantly see available vs. total balances by account, asset type, or category.
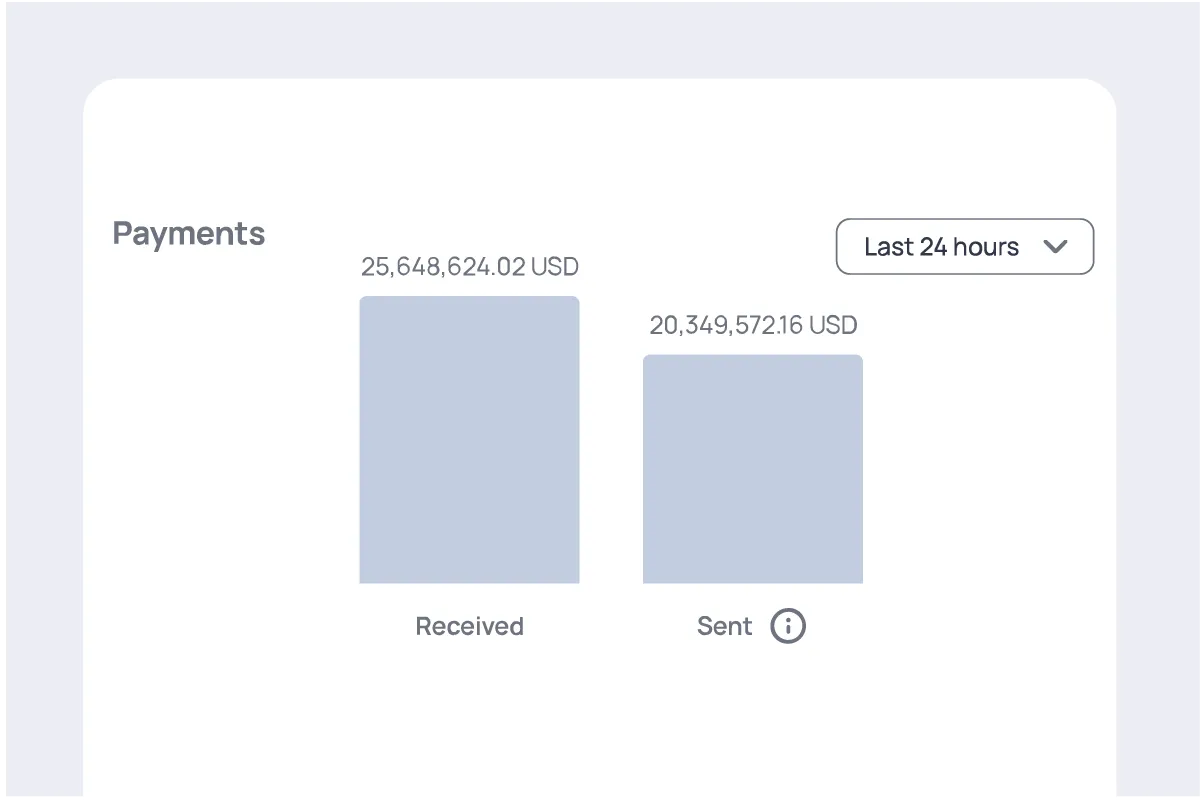
Monitor payment flows and track funds sent and received. Quickly spot discrepancies or accounts with insufficient balances.
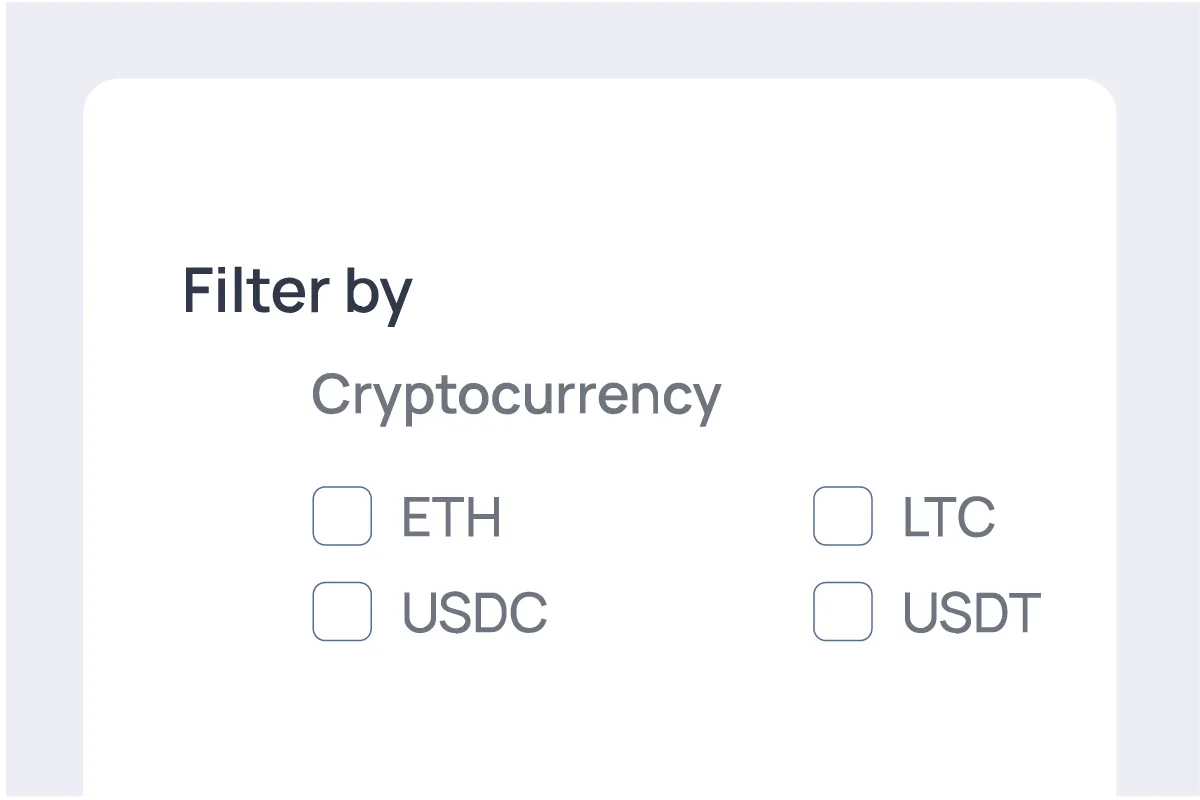
Filter data by business unit, currency or time period to focus on what matters.
Built to support decision-making at the operational level, these dashboards help teams act fast and stay aligned.
What makes our dashboards stand out

Real-time data sync
Access real-time insights across teams and entities. No more waiting on reports or chasing spreadsheets, confident decisions happen faster when the data is always up to date.

Executive level analytics
Provide high-level visibility into balances, flows and performance trends without exposing the noise of operational detail. Executives stay focused, and teams stay aligned.
.svg)
Multi entity cash visibility
Track balances across accounts, regions and business units in one view. Treasury and finance leads can forecast more accurately and allocate funds with greater precision.

Built in anomaly detection
Identify unusual patterns as they happen, not after. Spot issues early, take action quickly and maintain control in fast-moving environments.
See how Fortris empowers executive decision-making
Streamline oversight, optimize liquidity and lead with data you can trust.